1 R, RStudio, and Posit Cloud
1.1 Installing R and RStudio
R and RStudio are free to use and install software. The guide below provides the steps to install both software.
1.1.1 Installing R
Windows OS (10/ 11): Download R-4.4.2 for Windows and run the installer. This is the latest version at the time of writing this chapter.
Mac OS: There are two versions of R for Mac users based on the processor in your computer.
- For M1, M2, and recent M_ processors: Download R-4.4.2 for Mac M-Processor and run the installer
- For Intel processors: Download R-4.4.2 for Mac Intel processor and run the installer.
Linux Users R installation on Linux depends on your distribution. Open terminal (Ctrl + Alt + T) and enter the command below based on your distribution.
- Debian/Ubuntu distribution:
#| eval: false
$ sudo apt update
$ sudo apt install r-base r-base-dev- Redhat/Fedora distribution:
#| eval: false
$ sudo dnf install R
1.1.2 Installing RStudio
To install RStudio, visit the link https://posit.co/download/rstudio-desktop/ scroll down and download the package for your OS, and install. Installation of downloaded file is direct. If you prefer a video guide, choose the link based on your OS:
1.2 The RStudio Interface
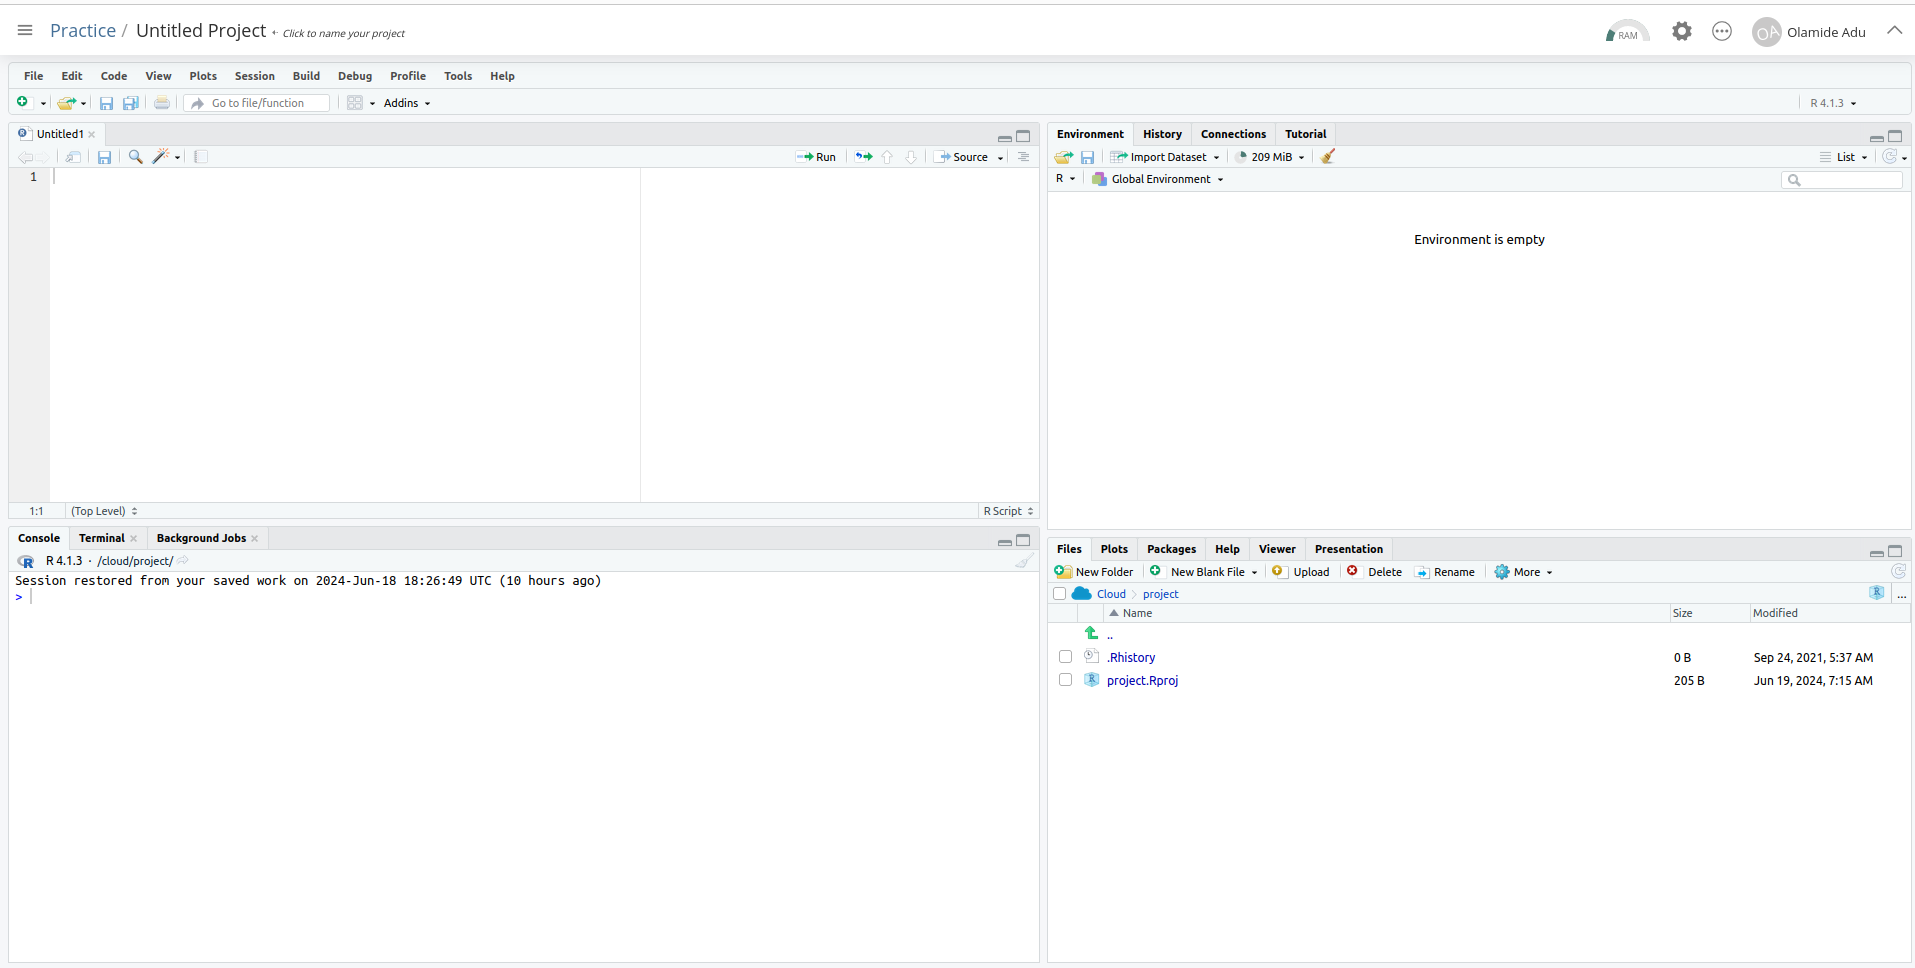
When you open RStudio newly, you are presented with three panes by default. To get a fourth pane like what is shown in Figure 1.1, click the + button at the top-left and select R Script, or use the keyboard shortcut Ctrl + Shift + N on Windows/Linux and Cmd + Shift + N on Mac.
You can change the arrangement of the panes by clicking Tools on the menu bar then navigate to Global Options and Pane Layout in the popup box.
1.2.1 RStudio Panes
The four components/panes shown in Figure 1.1 are:
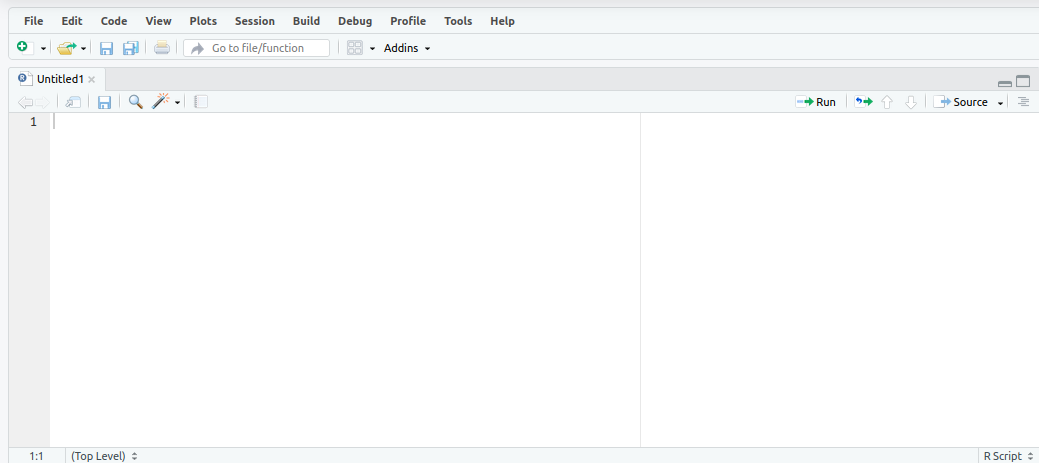
- Source Pane: Located in the top-left. This pane shows after adding a R script. The R script is where you will do most of your data analysis task. It is technically a plain text file with a .R extension containing a series of R commands that are executed in sequence. It also serves as an editor for other programming languages. The source pane displays the dataset in spreadsheet-like format.
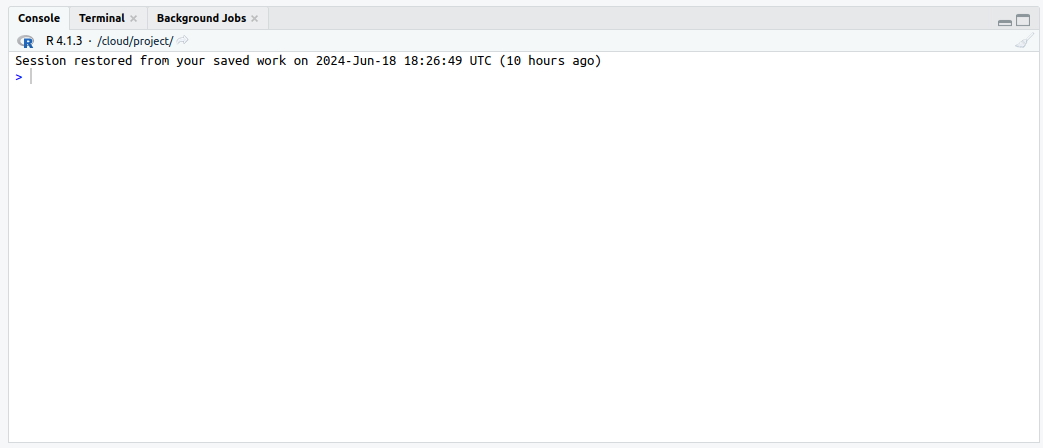
- Console/Terminal/Background Jobs pane: Located in the bottom-left. It include the Console tab where outputs and results of your analysis are displayed. The console is also an interactive section where you can write code and carry out some analysis. All the codes written in the script are usually displayed and executed on the console. This pane also include the Terminal tab which provides direct access to your computer through a command line interface. Lastly, we have the Background Jobs tab which allows you to run tasks in the background while you continue working on other tasks in the main R session. This pane is especially useful for long-running operations that might otherwise block your R session, such as data processing, simulations, or model fitting. You can read more on background jobs on RStudio User Guide.
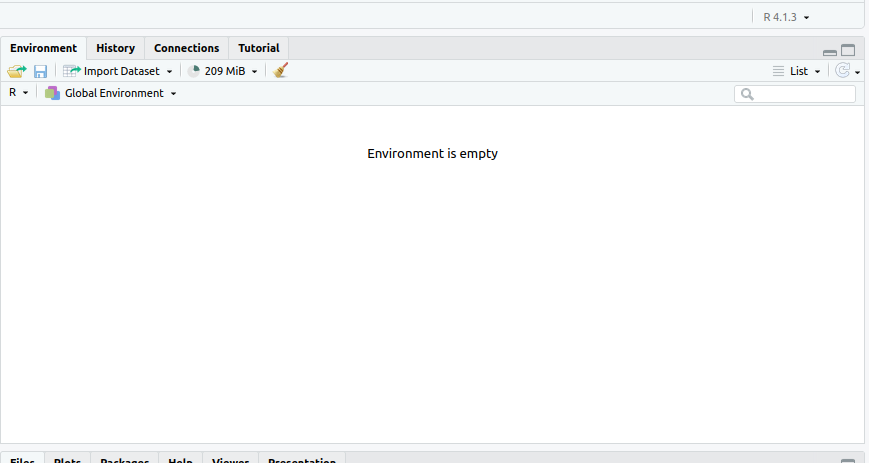
- Environment/History/Connection/Tutorial Pane: Located in the top-right. It includes the Environment tab which displays all objects created during a session, such as data and variables. It also includes some important features to import data, load and save a workspace and clear objects in an active workspace. We also have the History tab which stores the history of commands executed. This tab allows you to select previous commands and rerun them or add them back to console if you want. Located closely to History tab is the Connections tab which helps you interact with and manage connections to external data sources, such as databases, cloud services, or remote data systems. It displays the connections you have made to data sources, and lets you know which of them are active. After the Connections tab is the Tutorial tab which provides additional learning materials for R and RStudio. It is designed to be an interactive R tutorial and it runs on shiny and learnr package (You will learn about packages later).
An R session refers to the instance of R that is currently running, which includes everything that is active in memory and the state of your environment in RStudio or any R interface.
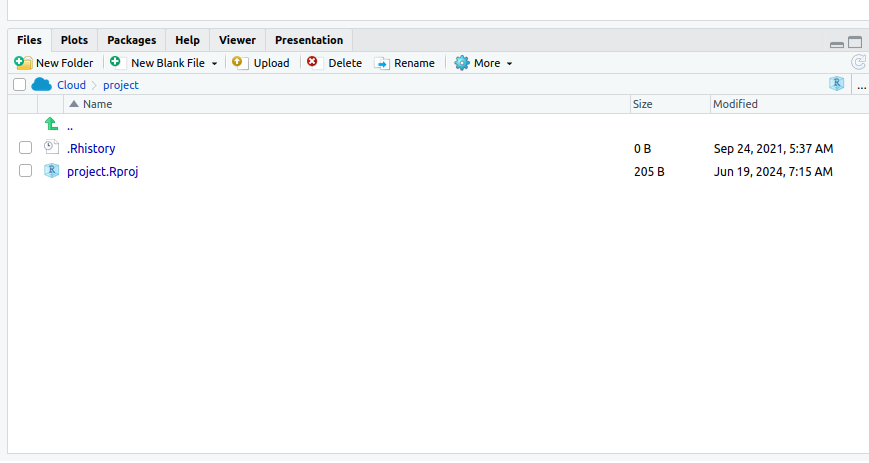
- Files / Plots / Packages / Help / Viewer Window: This is located in the bottom-right. The Files tab shows files and folders in your working directory. It also include buttons for renaming, deleting, creating, copying and moving files and folders just like your native file manager. The Plots tab is next and it displays visualizations, providing the option to zoom in or out, and copy to clipboard graphs created. The Packages tab follows closely and it helps to manage packages you have installed. It provides the option to update, install and remove packages through a GUI. Next is the Help tab, and it houses the documentation of functions, and vignettes for different packagesred. Next is the Viewer tab which is used to display a variety of visual outputs including interactive web content, plots, maps, rendered websites, and web-based applications. Lastly is the presentation tab which is used to view slides created through the R Markdown ecosystem.
It is advised to use a script to ensure reproducibility. It ensures you can edit your work when you make errors, share with others your analysis, and also reproduce all steps in your analysis instantly.
1.3 Posit Cloud
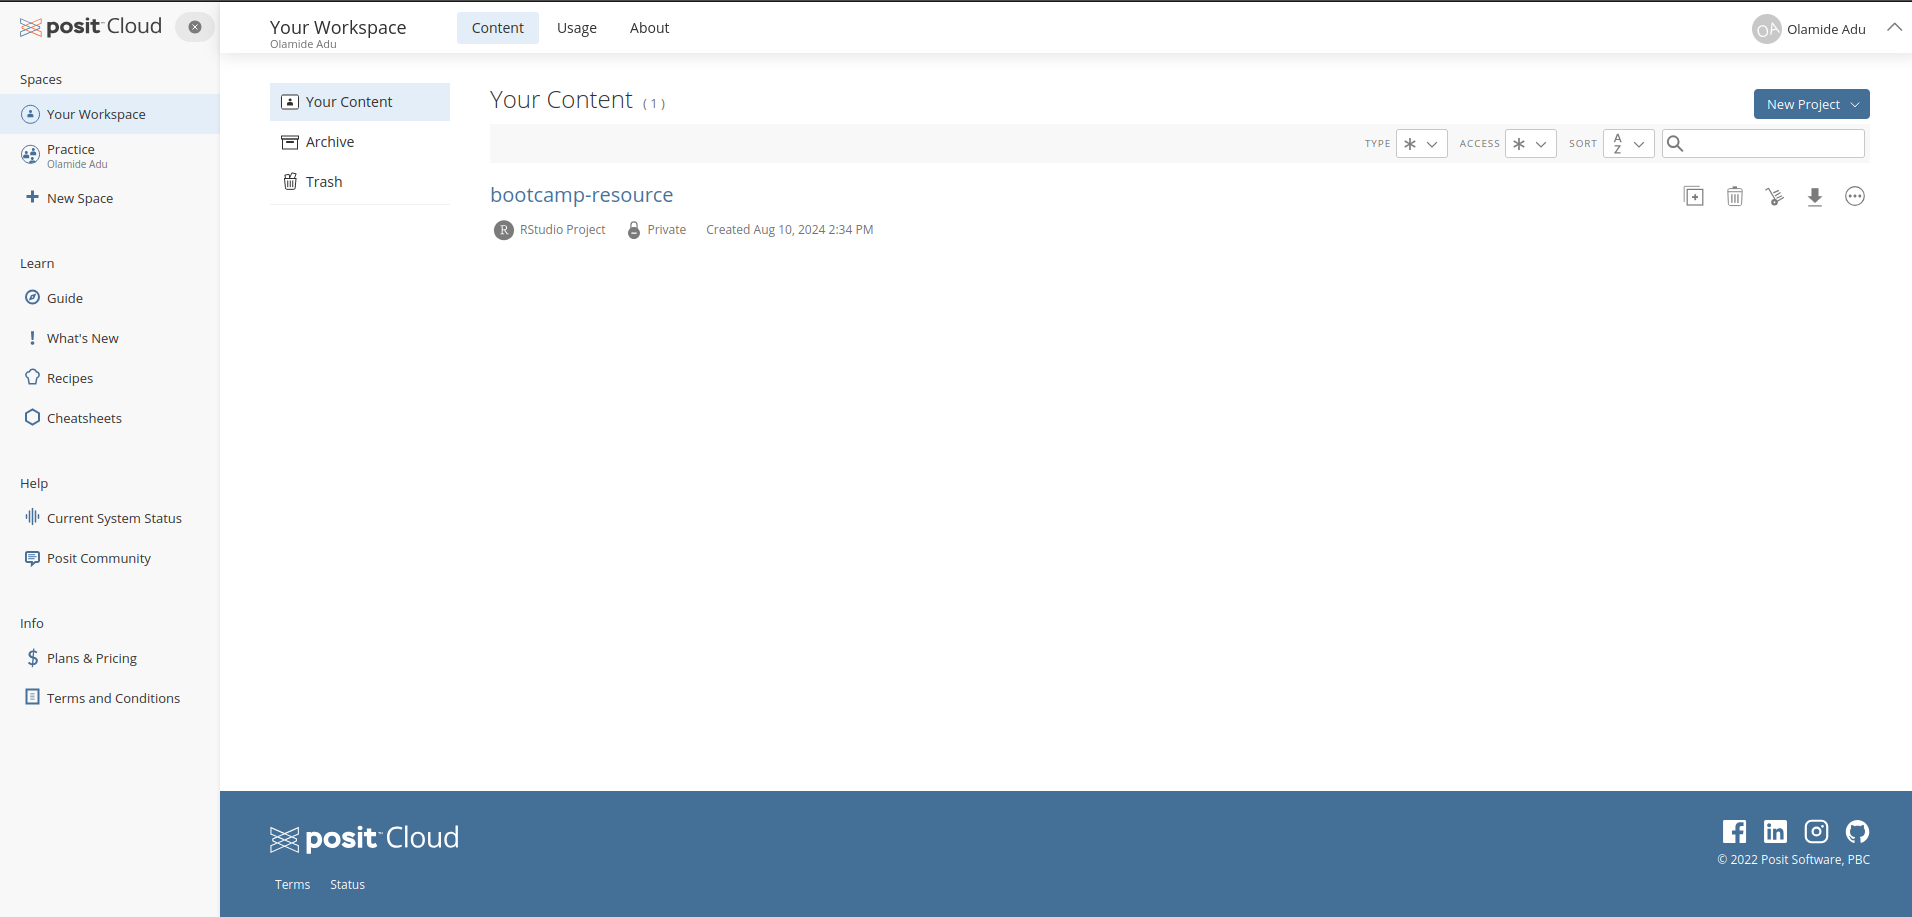
There’s an option to use R and RStudio online from your browser. This is through Posit Cloud (formerly RStudio Cloud). Posit cloud is owned by the same organization that made RStudio. To use posit cloud, visit https://posit.cloud/ and register. After registering, you get a page similar to Figure 1.2, then click on new space on the left sidebar then new project on the right side to start a new R session. Options to start from a git repository and a template file is also provided.
The video series in this link is a good resource for starting with Posit Cloud.
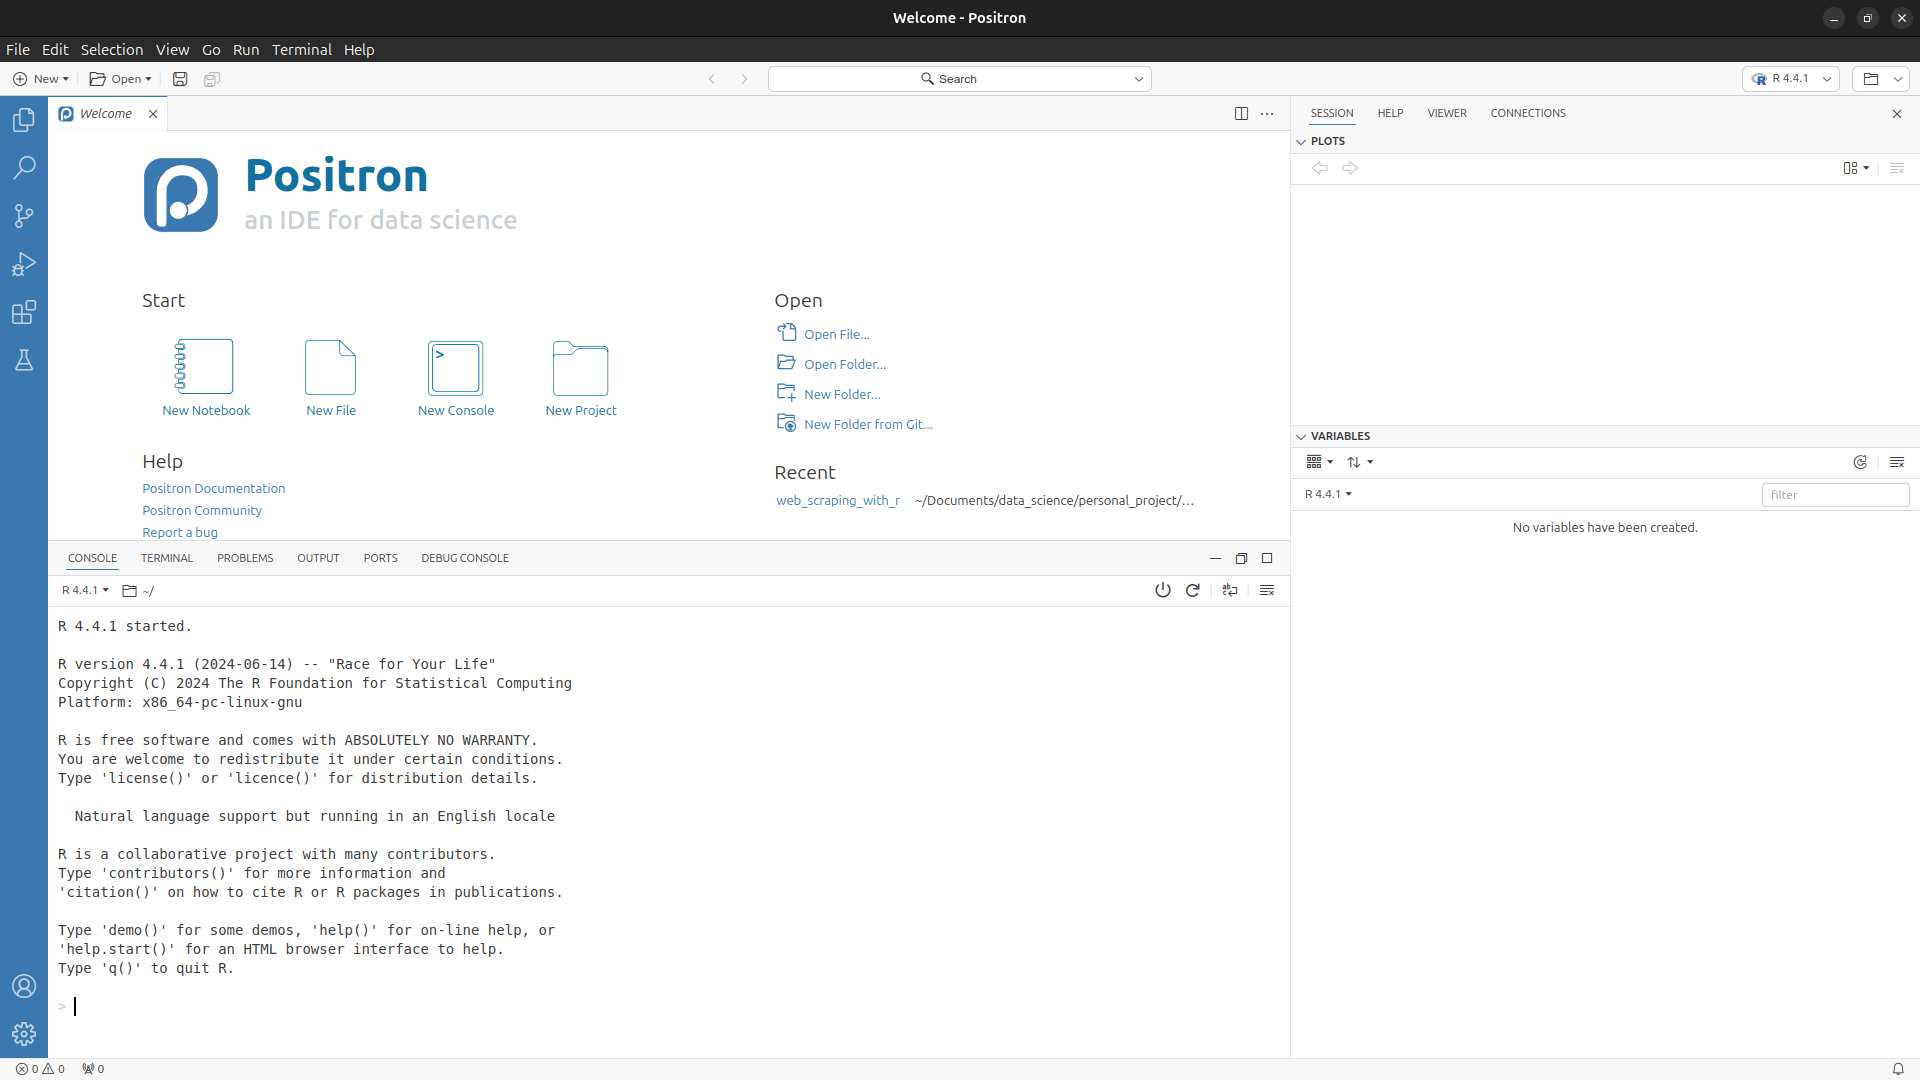
1.4 Positron
There’s a new IDE that supports Python and R that is still under development by the company Posit PBC. This is called Positron. Positron is still in its early stage of development. Positron is a blend of the popular IDE VS Code and RStudio, with the major inspiration from VS Code, (Radečić 2024). What makes Positron different is the ease of using python, which is one of the most common programming language of choice for data professionals. To get more details about the development, click here and here for detailed introduction on Positron.
Summary
In this chapter we covered how to install R, and RStudio. We also introduced the different panes/windows of RStudio IDE which includes, the source, environment, console and files panes. Lastly, we introduced the Posit cloud platform, a cloud-based RStudio platform as well as Positron, which is the next iteration of IDE from Posit.co